Description of reduced data products in the ESO Science archive
(Status: 02 August 2017)
The ESO Phase 3 archive provides access to reduced and calibrated data products. All these data are stored in standard formats and can be queried via the ESO Archive Science Portal.
The data are either provided by external users such as the ESO Public Survey consortia and the ESO Large Programme teams, or produced by ESO using science grade reduction pipelines.
Here we give an overview of the types of data currently provided. For details see the ESO Science Data Product Standard and the release descriptions provided for each data collection available at the following URLs, from the community http://eso.org/rm/publicAccess#/dataReleases and the in- house processed products http://www.eso.org/sci/observing/phase3/data streams.html.
Calibrated images, flux maps and source lists
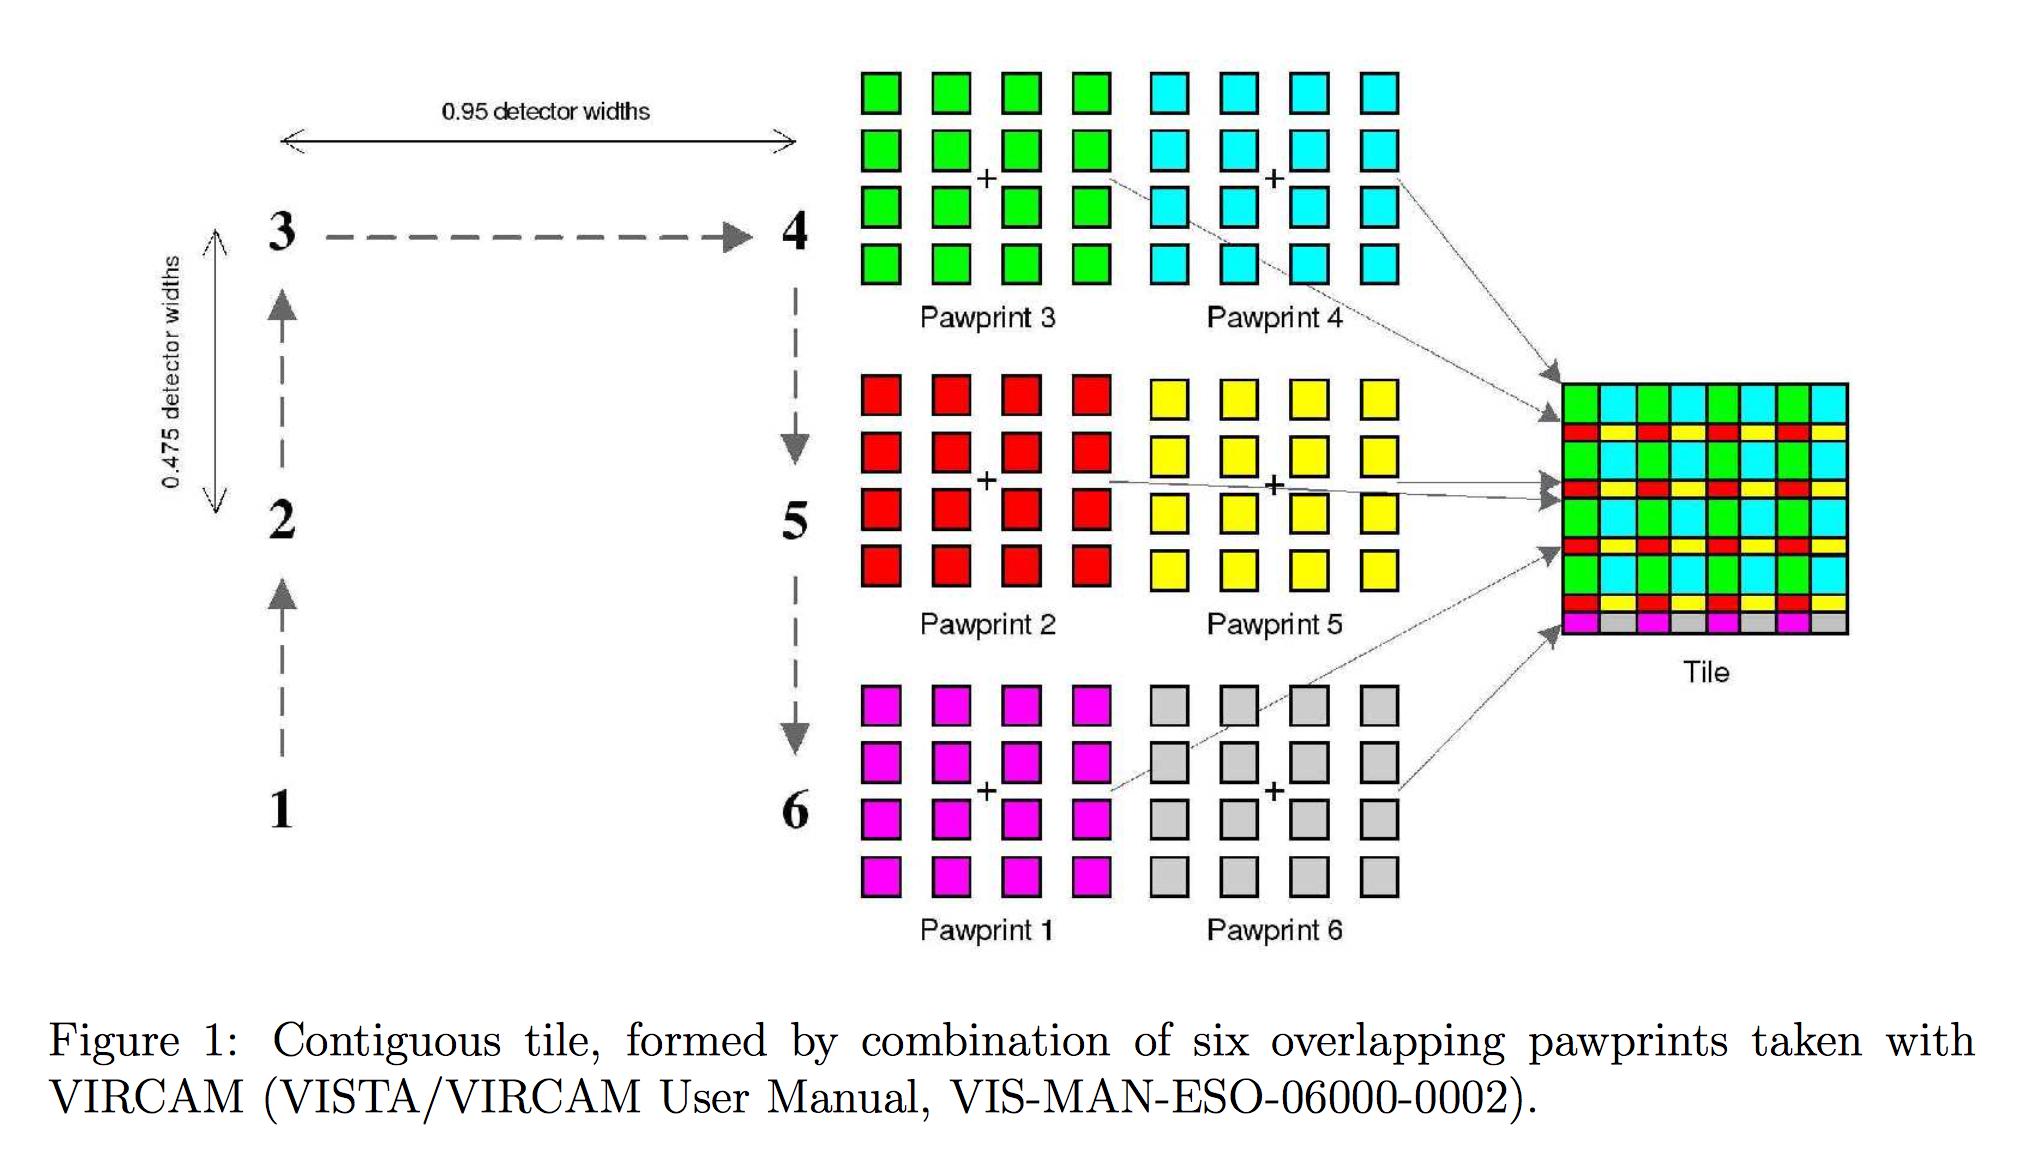
The VISTA and VST public imaging surveys provide reduced, photometrically and astrometrically calibrated images. The VISTA/VIRCAM and VST/OmegaCAM instruments with their mosaic CCDs produce non-contiguous images of the sky in a single exposure. The gaps between the single detectors of OmegaCAM are much smaller than those of VIRCAM. Those non-contiguous images (also called “pawprints”) are stored in multi-extension FITS files, where each extension corresponds to one of the 16 (VIRCAM) or 32 (OmegaCAM) images produced by the single detector chips.
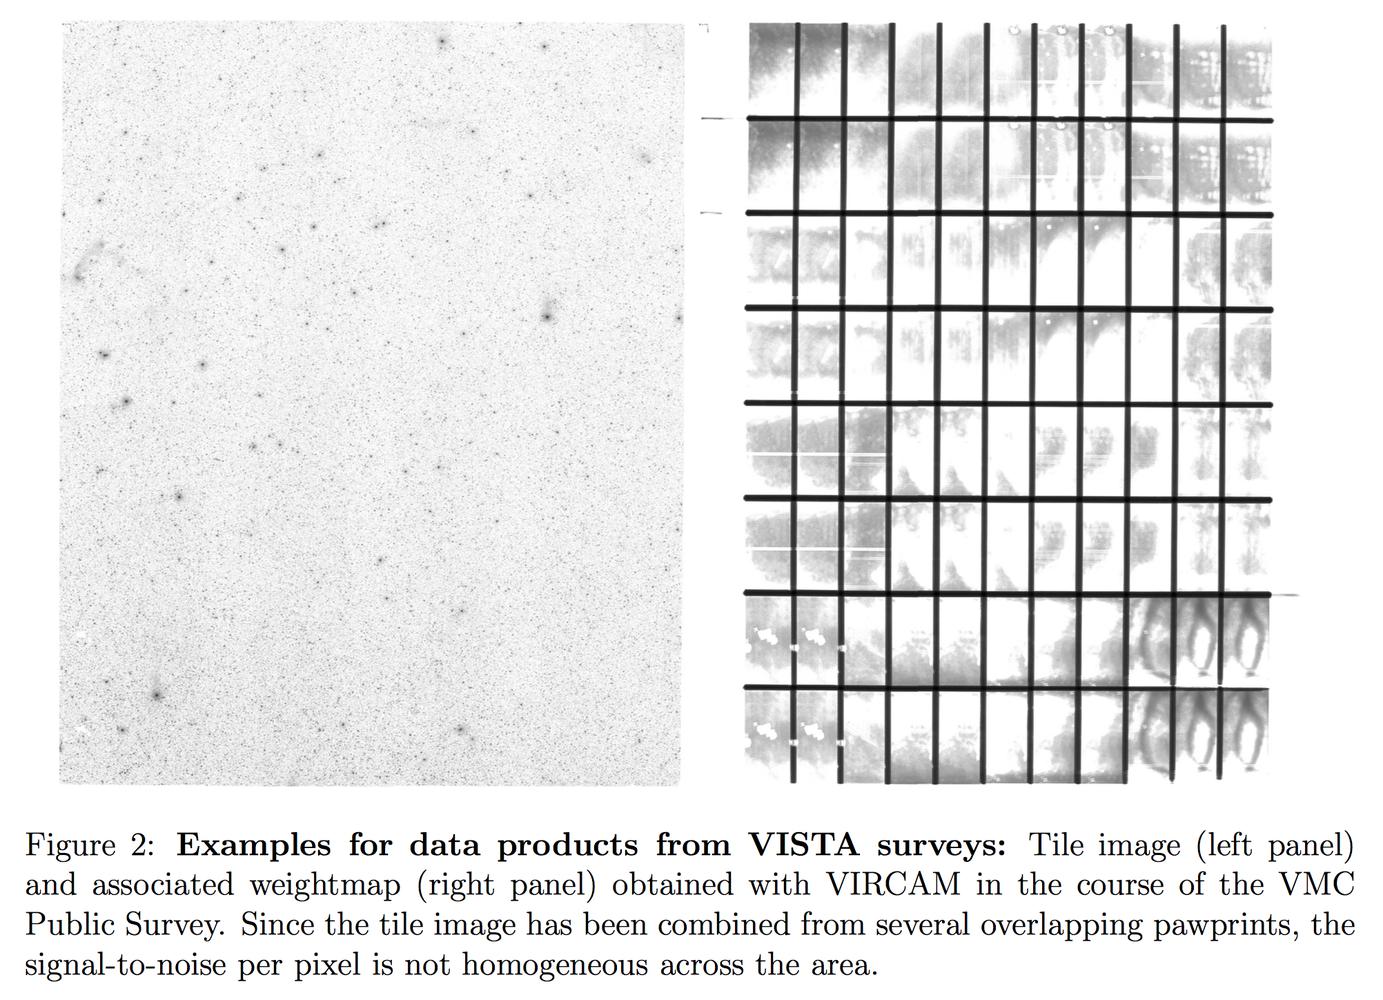
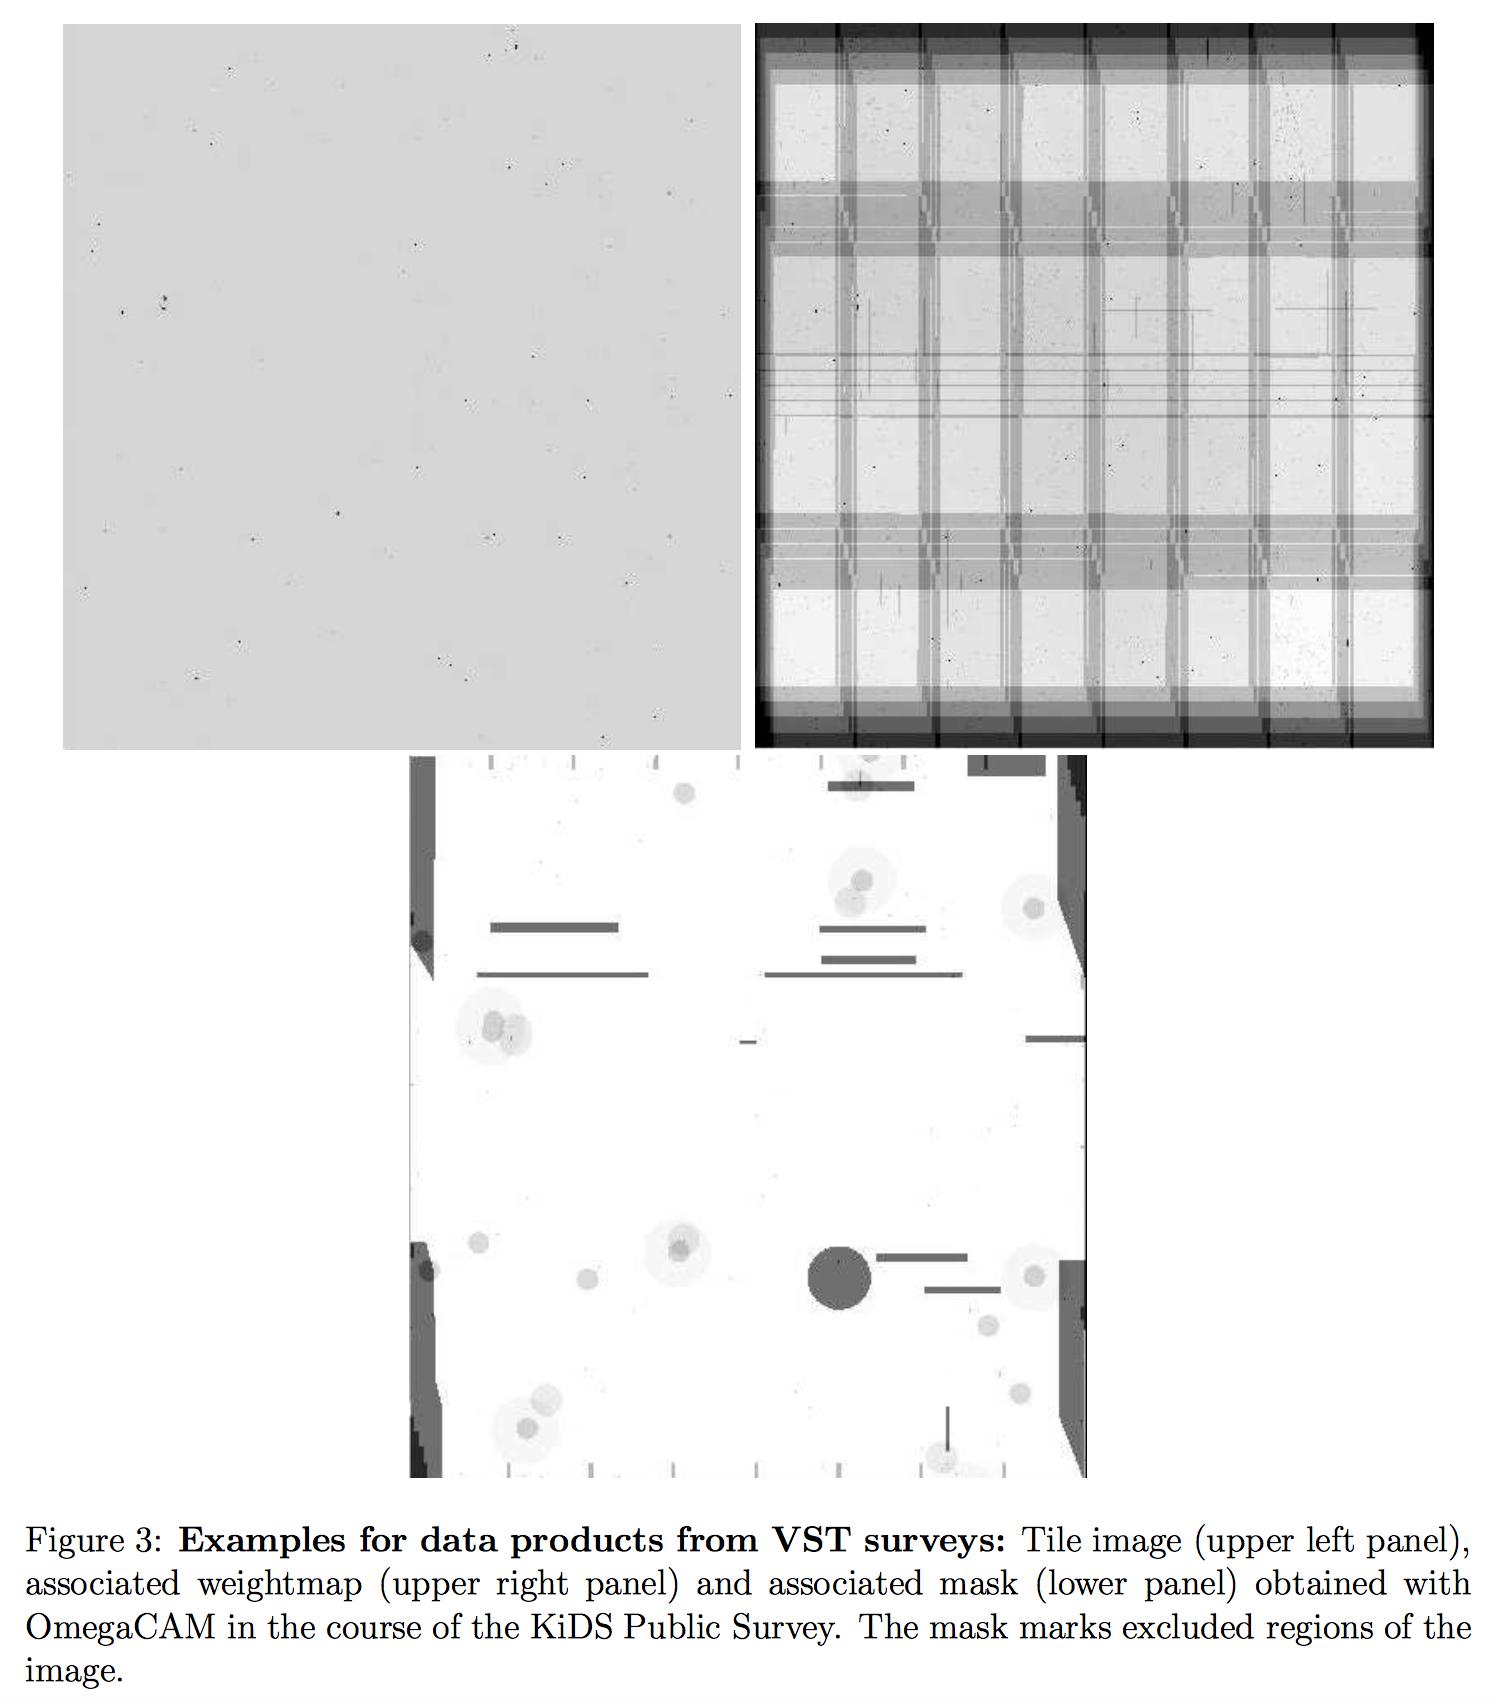
The building blocks of the VISTA surveys are the “tile” images. The tile is a combined image of the field of view with no gaps (see Fig. 1,2). Tile images resulting from the coaddition of several individual images are termed as deep tiles (e.g. UltraVISTA, VIDEO). Tile images are provided as single-extension FITS files. The VST surveys follow a similar approach of combining multiple exposures. However, the resulting contiguous images are either re-gridded as single-extension tile images (e.g. KiDS) or stored as multi-extension FITS files (e.g. ATLAS, VPHAS+). The tabular data of sources extracted from imaging data products are named “source lists”. Typically, each image has a corresponding single-band source list. Ancillary data products are associated to scientific data products without being directly searchable via the query interface. For imaging data, weight maps giving the statistical significance of each pixel are associated to the images (see Fig. 2, right panel; Fig. 3, upper right panel). Other optional data products, sometimes associated to imaging data, are gain maps specifying the number of electrons that contributed to each pixel value of the image or masks to mark corrupted regions of the image (Fig. 3, lower panel). These ancillary data are stored in separate FITS files and automatically delivered together with the selected science files for download.
Since 2016, the flux maps at a wavelength of 870 μm of 420 sq. deg of the Milky-Way inner plane from the APEX Telescope Large Area Survey of the Galaxy (ATLASGAL) survey are available from the ESO archive. The variance map, source lists and associated catalogs are also provided.
A recent addition to the portfolio of reduced images in the ESO Science archive are the High Acuity Wide field K-band Imager (HAWK-I) near infrared images and source lists, which are produced as part of the ESO in-house reprocessing and also as science products from ESO Programmes, see for example the deep HAWK-I images for the Hubble Frontier Fields. The HAWK-I products include multi-extension stack exposures (4 detector chips), mosaiced tiles and source lists, plus variance and confidence maps as ancillary files.
Calibrated spectra and data cubes
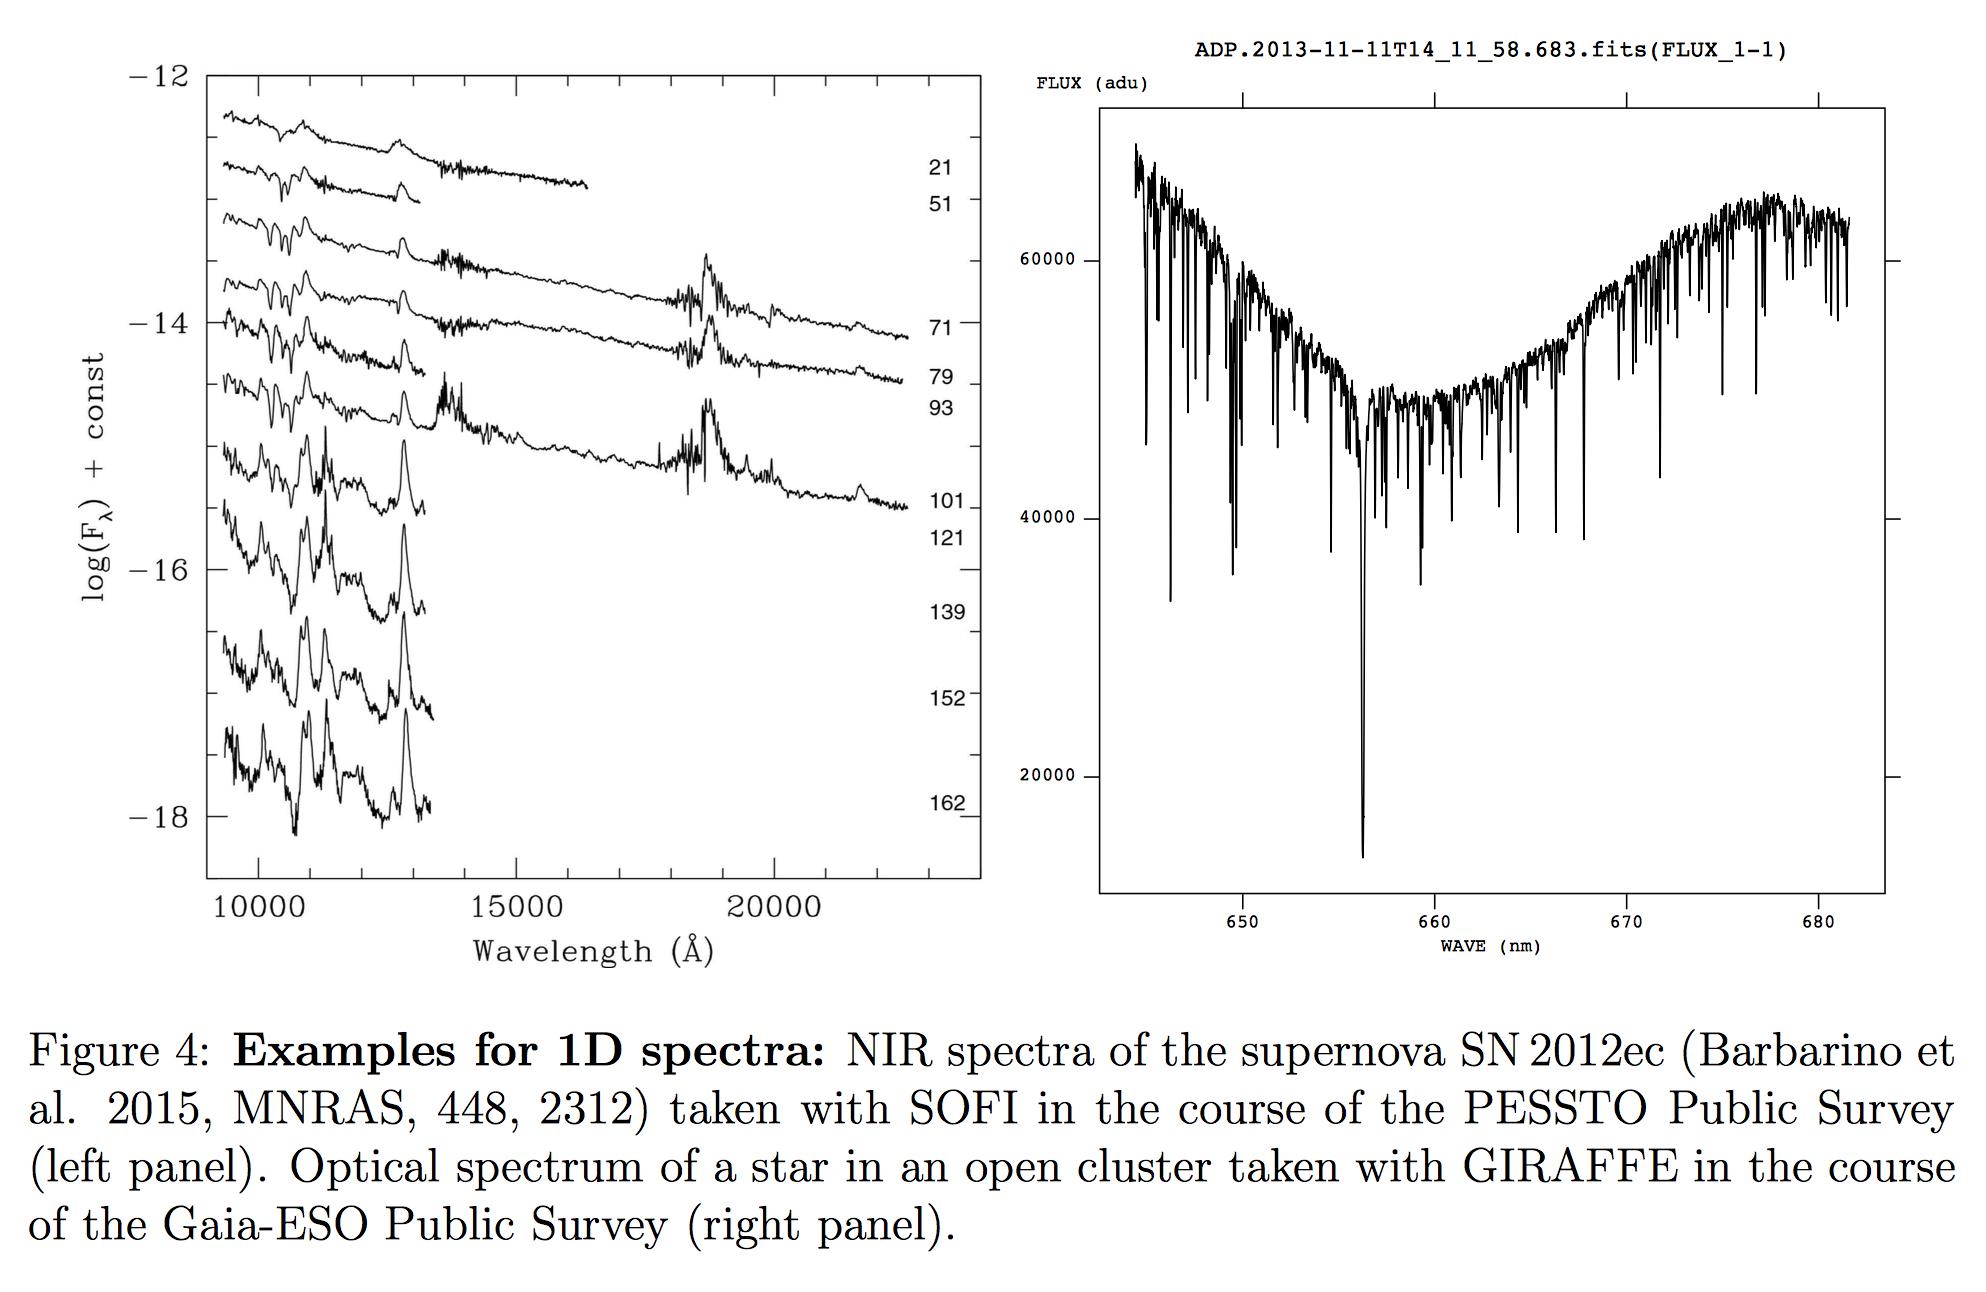
The public spectroscopic surveys at the VLT and the NTT provide one-dimensional reduced and wavelength calibrated spectra in FITS binary table format (Fig. 4). Information associated to science spectra is stored within separate columns of the same FITS-file as the science spectra themselves. Each data array (i.e. wavelength, flux, error, quality...) is provided in a single cell of the one row contained in the binary table. Wavelengths can be calibrated using wavelength lists measured in dry air (at standard temperature and pressure) or in vacuum, according to the value captured by the unified content descriptor for the wavelength array in the product’s header.
Reduced spectra of selected instruments are also produced in house by ESO using science grade pipelines. Until now archival data from UVES, XSHOOTER, HARPS, FLAMES/GIRAFFE and FEROS have been reprocessed and published. Newly obtained spectra are automatically reduced shortly after the observation. They are immediately accessible to the PIs via the user portal account and released to the public after the proprietary period.
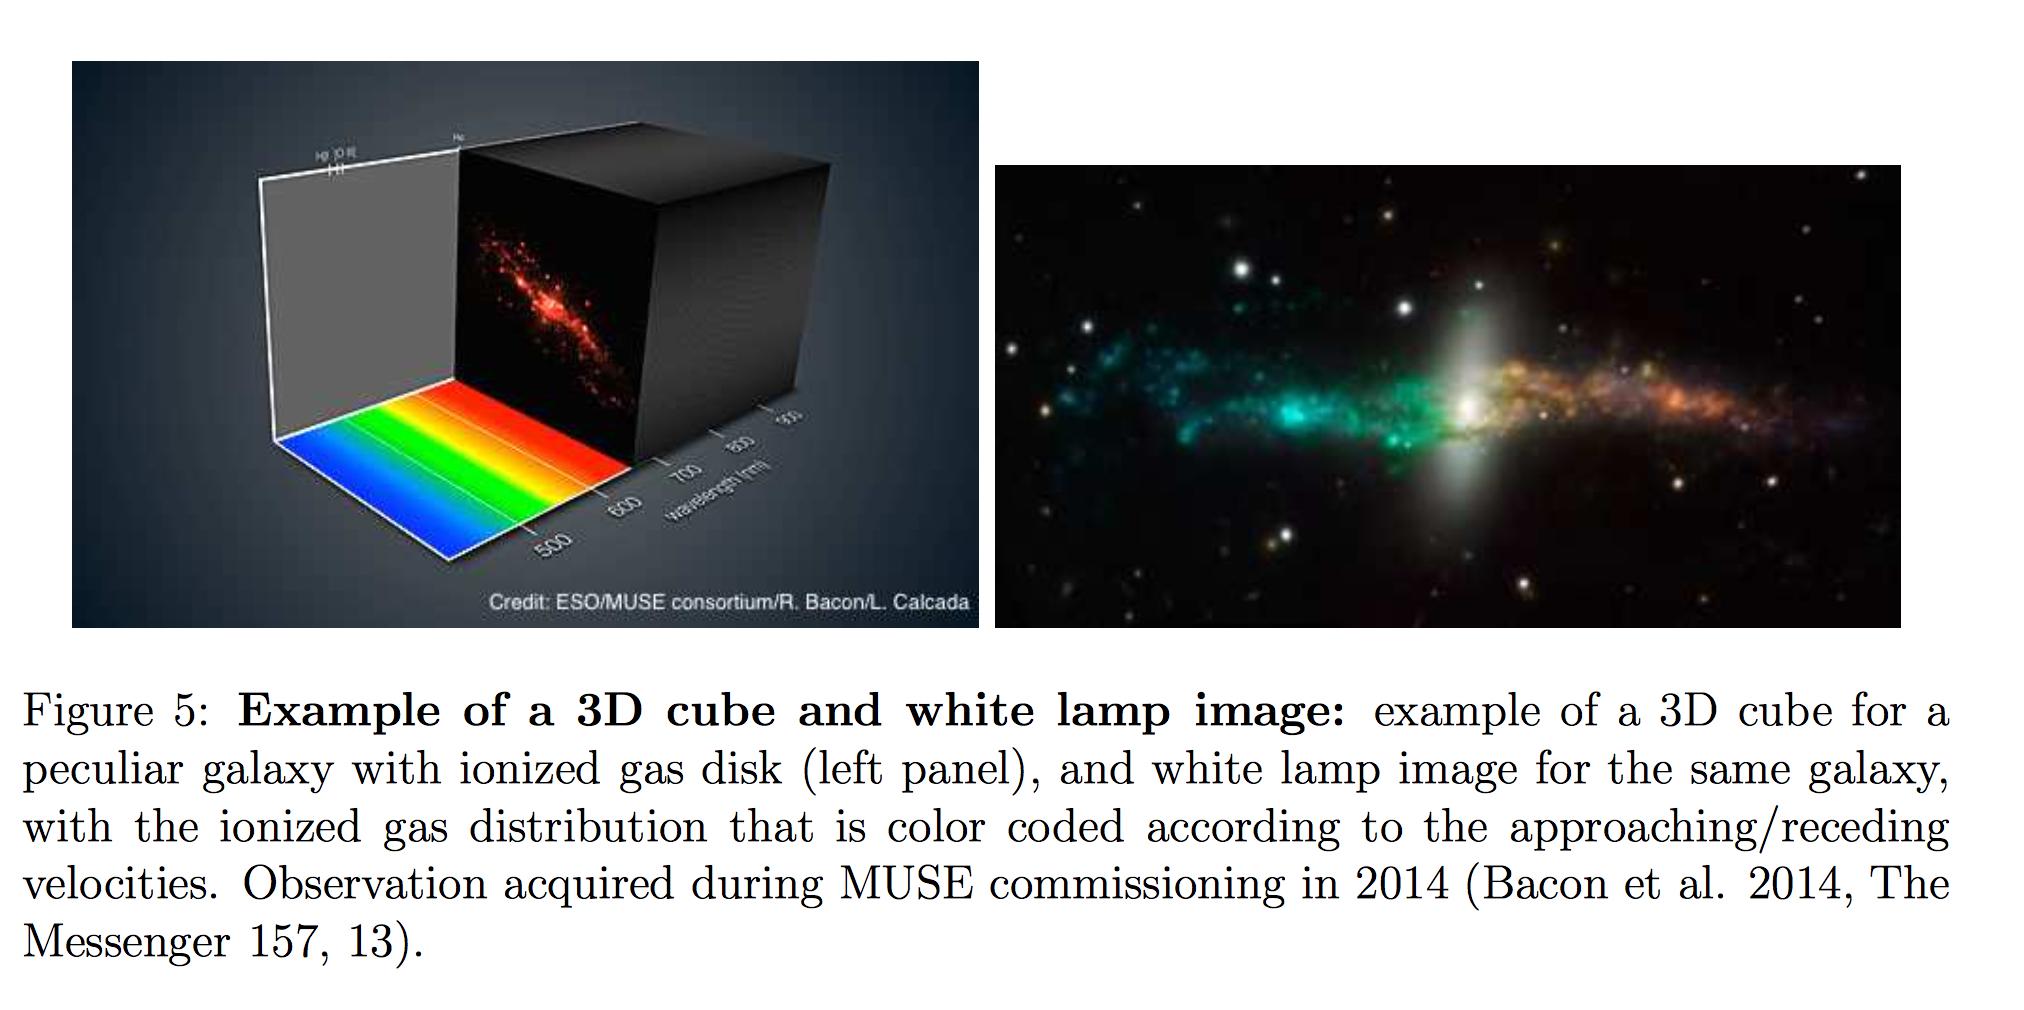
An important addition to the ESO in house processed products are the Integral Field Unit Multi-Unit Spectroscopic Explorer (MUSE) reduced data cubes. Each MUSE data cube has a three-dimensional image with two spatial and one spectral coordinates, in its first extension; in the second extension contains the error information. The MUSE products are wavelength (in vacuum) and flux calibrated, and each of them come with an associated additional fits file that contains the two-dimensional white-light collapsed data cube image. See Fig. 5 for an example of a three-dimensional calibrated cube and the corresponding white-light image, with additional color coding of the two-dimensional velocity field of the ionized gas in a galaxy.
Catalogues
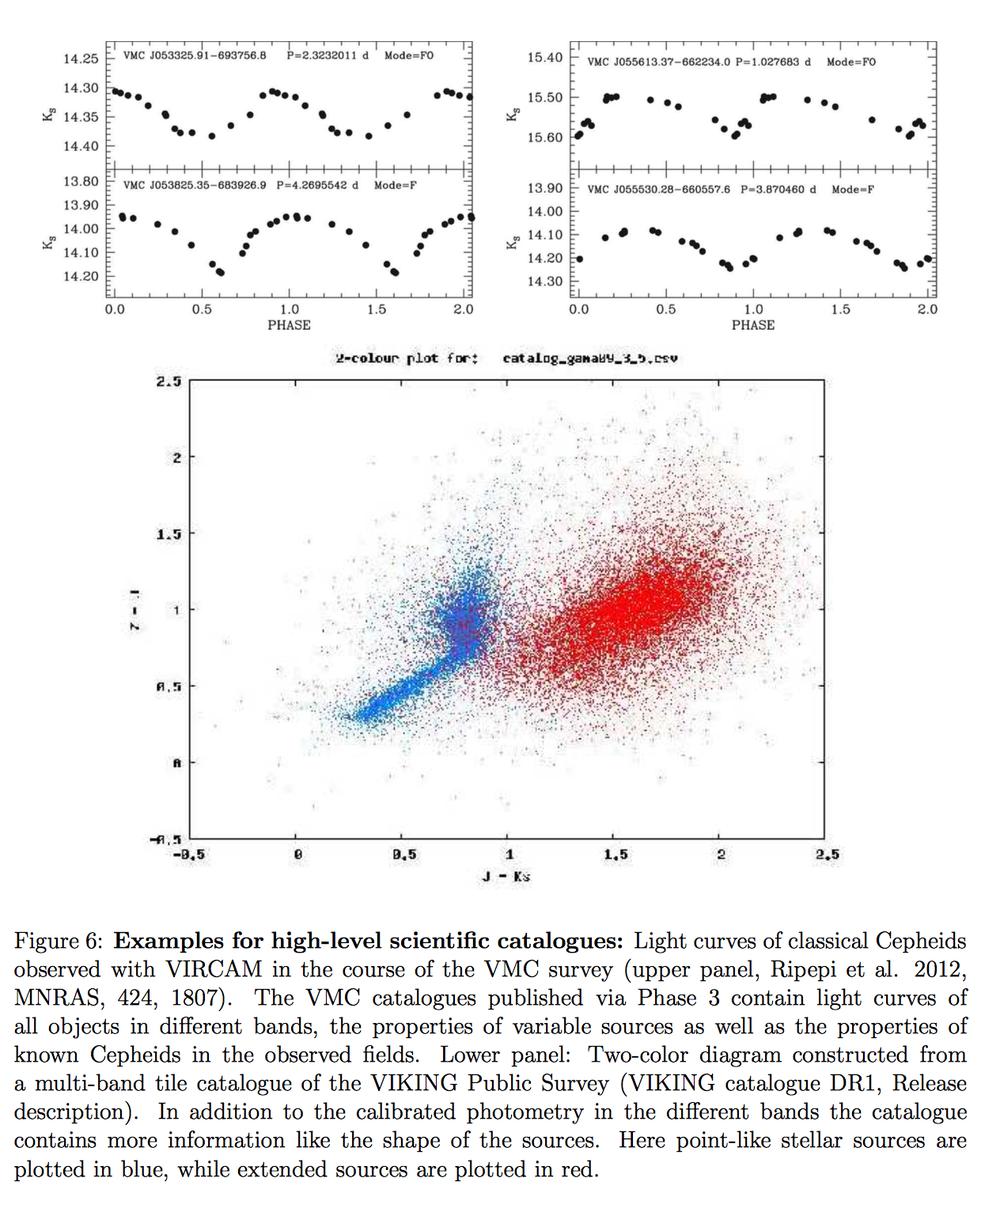
Catalogues may consist of sources extracted and band-merged from imaging data products, redshifts and additional physical parameter from spectra, or weak lensing shear measurements (e.g. KiDS release 3.1). These catalogues can be queried for single or multiple sources via the Phase 3 catalogue query interface (http://www.eso.org/qi/) by performing a cone or box search. Alternatively, the catalogues can also be downloaded partly or as a whole from the Phase 3 main query form of the ESO archive, together with the image or spectral products from which the measurements are extracted. Simple catalogues are stored in one single binary table. Larger catalogues are stored in multiple files. For imaging surveys, each data file contains the extracted band-merged catalogue of one corresponding survey tile (see Fig. 6, lower panel). In addition to the multi-band source catalogues, imaging surveys with multi-epoch observations provide light curve catalogues and catalogues of variable objects (e.g. VVV, VMC and PESSTO, see Fig. 6, upper panel).
Customer support service by UserEcho
