- News & Ads
-
 Feedback

Second data release of the VISTA EXtension to Auxiliary Surveys (VEXAS)
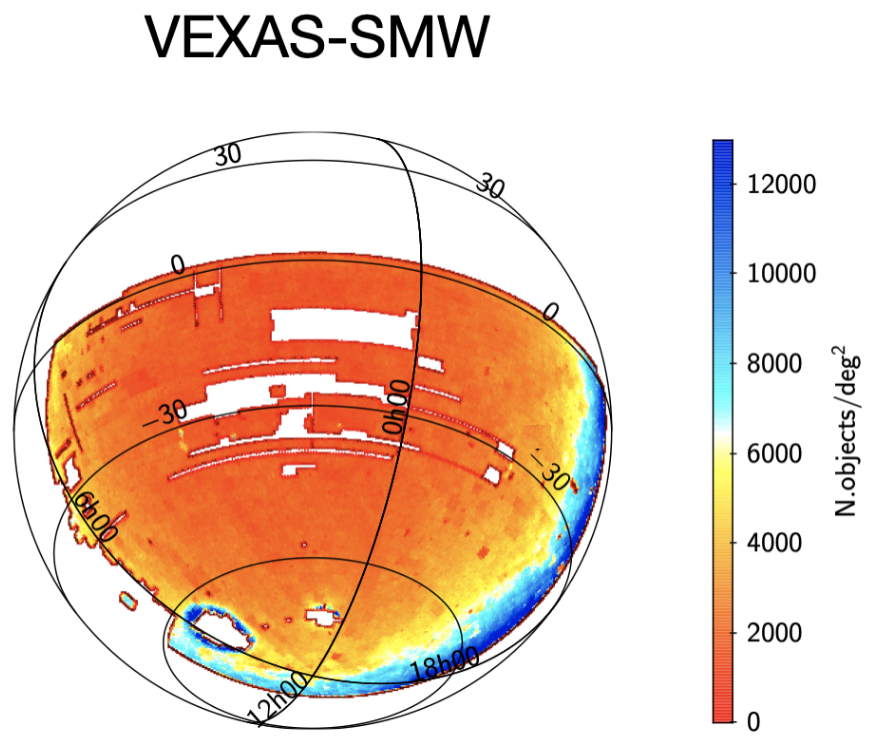
The VISTA EXtension to Auxiliary Surveys (VEXAS, Spiniello & Agnello, 2019) project aims at building wide and spatially homogeneous multi-wavelength catalogues (from X-ray to radio) providing reference magnitudes, colors and morphological information for a large number of scientific uses. Currently the VEXAS catalogue is the widest and deepest public optical-to-IR photometric and spectroscopic database in the Southern Hemisphere, comprising more than 90 million objects with reliable photometry measured in at least one of the VISTA infrared bands, two of the WISE bands and three optical bands.
This second release provides a new version of the three VEXAS DR1 optical+infrared tables: VEXAS-DESW, VEXAS-PSW and VEXAS-SMW in which sources fainter than 25 mag have been removed and additional quality improvements were applied. Objects are now classified into stars, galaxies and quasars using an ensemble of thirty-two different machine learning models, based on three different algorithms and on different magnitude sets, training samples and classification problems (two or three classes). A new version of the spectroscopic table is also
provided. In order to build a training sample as large as possible and as complete and clean as possible in all the three classes of objects, on top of SDSS, 5 additional surveys have been used in this new version (SDSS DR16, Ahumada et al. 2019; WiggleZ, Drinkwater et al. 2018; GAMA DR3 Baldry et al. 2018; OzDES, Childress et al. 2017; 2QZ, Croom et al. 2004; and 6dFFS DR3, Jones et al. 2009) to which strict selection criteria have been applied. The machine learning pipeline and main results on the classification are described in detail in Khramtsov et al. (2021).
Detailed information are available in the accompanying release documentation. The tables are linked to the primary one and can be queried together via the ESO Catalogue Query Interface or programmatically.

Customer support service by UserEcho

It is also possible to explore the catalogue via the Archive Science Portal. This interface allows users to visualize the distributions of different columns in a catalogue tile in a comprehensive page, by clicking on the action Dataset details. An example of this is shown in the image above.