ESO ARCHIVE COMMUNITY FORUM
!!! THIS INTERFACE IS GOING TO BE DECOMMISSIONED SOON !!!
Please use instead https://support.eso.org
The ESO Archive Community Forum is a platform for sharing ideas and methods, asking questions and sending feedback and suggestions on how to improve and use the new ESO Archive Science Portal and on how to gain Programmatic and tool access to the archive science portal.
Contributions from all users are encouraged, also without registration.
To participate in the knowledge exchange, please choose an appropriate Forum from the right panel or from the drop-down menu on the top of this page and write a message. An agent from the ESO Archive Science Group (ASG) will receive, moderated it, and make it public as soon as possible.
Currently, open forums are:
- News & Ads: stay up-to-date with the last events and data releases on the ESO Archive.
- Archive Science Portal: find help and discuss about the new graphical web user interface that offers access to ESO Phase3 and ALMA data jointly.
- Phase 3 Data Products: ask questions about data products released on the ESO Archive.
- Programmatic Access: explore the potential of Programmatic Access to select data given physical and instrumental parameters.
- Open Discussion: trigger discussion on the ESO Archive content and interfaces among users.
The ESO Archive Community Forum also provides help pages about the data access and retrieval, and about the data types used in the ESO Archive.
Please be aware that the channel to receive help concerning data access, data reduction and pipelines, and quality of products is provided by the ESO helpdesk.
Please observe the usual basic etiquette rule of remain professional, respectful, and courteous at all times.

 First data release of the Burst Alert Telescope AGN legacy survey of molecular gas fueling in powerful nearby AGN
The APEX telescope has obtained CO(2-1) spectra for a sample of 165 hard-X-Ray-selected AGN galaxies detected in observations by the Burst Alert Telescope (BAT) onboard Swift. These observations, taken under the ESO programme id 198.A-0708, PI M. Koss, allow a statistical comparison of AGN and non-AGN dominated
galaxies in the local Universe, for example from the ALLSMOG APEX survey.
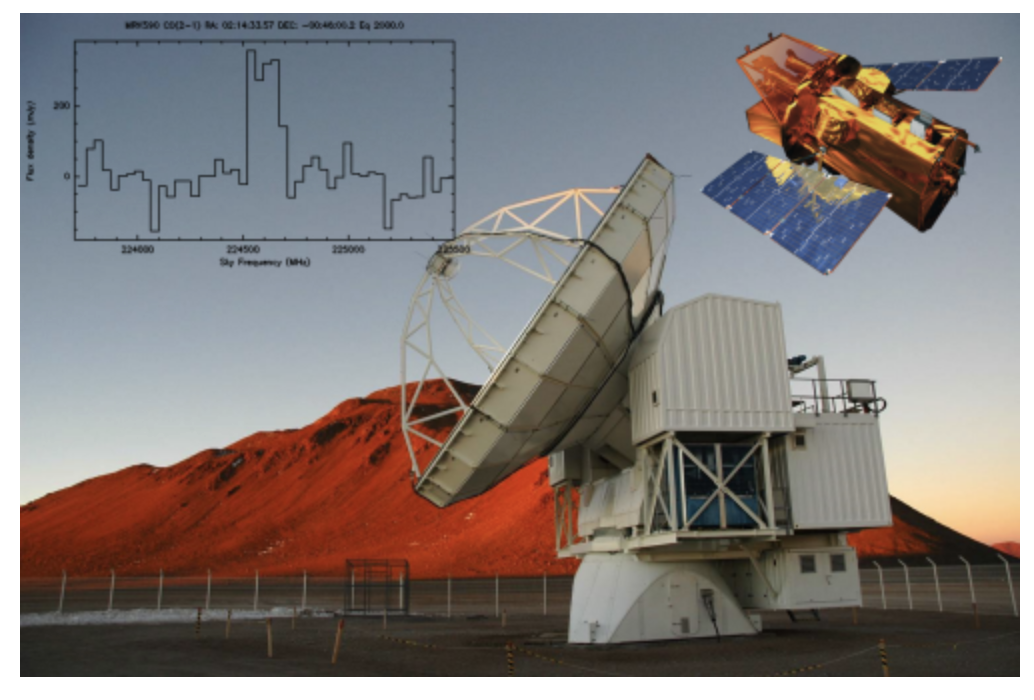
As this programme mainly aimed at observing a statistical sample of
nearby AGN, many of the galaxies observed are well-known galaxies, and these Phase 3 data can provide a valuable total power measurement of the CO(2-1) emission which then can be combined with interferometric observations obtained with ALMA.
Additionally, the BASS (BAT AGN Spectroscopic Survey) sample includes a variety of other ESO data products including hundreds of spectra with VLT/Xshooter, VLT/MUSE, and VLT/FORS2 with more information at the BASS survey website.
This BAT AGN release available via the Science Portal or programatically, makes the combined CO(2-1) spectra publicly available so users can derive further spectroscopic parameters, and compare them with other lines in these objects. The spectra either have a peak S/N>5 or reach depths of 0.5-2 mK rms for non-detections. Further details can be found in the data release paper or in the accompanying release description.
Instructions on how to read or display data in the ESO/SDP tabular data format can be found in the 1D spectrum data format help page.
 Reduced data for commissioning observations
Hello, I am wondering if reduced data exist for commissioning observations of NGC 5813, as those presented here: https://ui.adsabs.harvard.edu/abs/2015MNRAS.452....2K/abstract
Thank you.
Dear Anonymous user,
there are no reduced data of NGC 5813 taken during commisioning observations

Coordinate space
Hi, I'm a GIS mapper w maps of Moon & Mars in those co-ordinate spaces. Here, what's the coordinate space that objects such as the Milky Way are mapped in to keep track of their position and their movement. Where is what's the origin of such a coordinate space--is it the Earth's position in the cosmos or some other location? (2/17/2025 Joe Kerski "Spatial Reserves" open data blog)
Dear user, thanks for your inquiry.
In astronomy many coordinates systems exists to map the location of celestial objects, that serves different purposes, i.e. to easily manage the data in a more natural framework.
The argument is very vast and cannot be shortly explained in a web ticket, we will provide a brief introduction and some supporting links that could help to understand the big picture.
Like in Earth cartography the definition of a common and uniform coordinate system it has also a long history and there is a strong connection between Earth coordinates and celestial coordinates, and this fact was used by sailors for many centuries for determine their point on open sea, determining the altitude and azimuth of some known stars and Sun and hence determine their position.
But how the coordinates of these stars were and are defined? in ancient times the reference system was based on the ecliptic (the theoretical big circle in the sky) that "contains" the movement of the Sun and the planets, counting the celestial longitude on this circle, and the latitudes as distances from it.
However more recently it was introduced a system, the equatorial system that connect Earth and time to the position of stars in the sky. This system is what is actually used in astronomy. The system is defined in this way:
The big circle corresponding to the projection of the Earth equator on the sky (called the celestial equator), is the reference for the "longitude" that is called in astronomy Rigth Ascension (RA), the perpendicular angular distances to this circle measures the "latitude" that is called Declination (DEC). The zero point of the Rigth Ascension, is measured from the point of the Sun at the equinox of March (i.e. at the intersection of the ecliptic with the celestial equator).
As you can understand, non uniformity on Earth figure, precessional motion, polar motions, all alter this definition.
For creating a fixed reference in space that was not subject to all these problematics, it was created a new reference system called International Celestial Reference System (ICRS) centered on the Solar System barycenter whose orientation align within 0.02 arcsecond of the Earth mean equator and equinox. The ICRS is connected to the International Terrestrial Reference System (ITRS) via the measurments performed by the International Earth Rotation and Reference Systems Service (IERS).
As said before other coordinates systems exists, but what is mostly used is the equatorial system, for other purposes for example deep space missions is more used the ecliptic system. For all these systems precise transformations exists and are precisely defined by the International Astronomical Union in various publications and supported via well maintained software in Fortran and Python.
For analysis of stellar distribution in the Galaxy another system is used and is called galactic coordinates system, which uses as reference the galactic equator (the big circle corresponding to the maximum emission of the 21 cm emission line of Hydrogen), whose zero point is very close to the radio source Sagittarius A*. These coordinates are called galactic longitude (l: lowercase L) and latitude (b, lowercase B). Is interesting to note that the inclination between the galactic equator and celestial equator, galactic equator and ecliptic, are close to 60 degrees, meaning that the Solar System is higly inclined respect to the fundamental plain of the Galaxy and this creates a helical path as the Sun orbits the Galaxy at 230 km/s, much like Uranus rolls along its orbit around the Sun.
Another system related to the galactic system exist and is called galactocentric rectangular system, in which XYZ linear coordinates (not angles) are calculated from the Galactic Center. Both Galactic coordinate systems are very useful for understand the mass distribution in our Galaxy and to perform cartography of our neighbourhood, however only with the advent of Gaia mission we started to have more precise measurements of the distances of the objects around us.
basic information about the coordinate systems in astronomy
https://en.wikipedia.org/wiki/Astronomical_coordinate_systems
https://en.wikipedia.org/wiki/Equatorial_coordinate_system
a precise definition of the actual reference frames used in astronomy could be found here
https://aa.usno.navy.mil/publications/Circular_179
software libraries
http://www.iausofa.org/
https://docs.astropy.org/en/stable/coordinates/index.html
best regards
Mauro Barbieri
Add Planck map to Aladin Lite view in Science Portal (PLANCK R3 HFI color composition 353-545-857 GHz)
De support team!
I am not certain if this is the right place to post request, but it would be great if the Planck all-sky maps were also selectable in the Aladin Lite view in the ESO science portal.
thanks and best wishes
Dear User,
Thanks for contacting us,
indeed this is planned and a new version of the Archive Science Portal, containing also the Planck maps will be soon deployed.
Best regards,
the ESO Archive
Why are the associated GEOMETRY and ASTROMETRY reference files so old?
I am reducing newly taken MUSE data from the beginning of 2024. Yet the associated geometry and astrometry files are from April 2021. Where are the newer reference files? Instead of providing a new MASTER_DARK which rarely changes, run the astrometry and geometry calibration sequence more often (considering Chile experiences numerous earthquakes a year, etc.).
Dear User,
The MUSE GEOMETRY and ASTROMETRY calibration frames are taken regularly. They are processed automatically and checked for quality. The quality parameters are monitored in the specially designed Health Check plots:
https://www.eso.org/observing/dfo/quality/MUSE/reports/HEALTH/trend_report_GEOMETRY_HC.html
https://www.eso.org/observing/dfo/quality/MUSE/reports/HEALTH/trend_report_ASTROMETRY_WFM_HC.html
https://www.eso.org/observing/dfo/quality/MUSE/reports/HEALTH/trend_report_ASTROMETRY_NFM_HC.html
The MUSE geometry calibrations are quite high volume (~6 GB, 70 input raw frames) and their processing is hardware demanding. Thus, early in operations the decision was taken to provide the users only with the static (frozen in time) version of the master GEOMETRY_TABLE. The regular monitoring shows if there is a need to produce modified, newer version. Since April 2021 there has not been such a need identified yet. That is why the April 2021 version is still distributed with the 2024 science data. The MUSE astrometry is closely tide with geometry, so it is also provided in the static form. The ASTROMETRY version corresponds to the distributed GEOMETRY version.
There is always a possibility to download the latest calibrations (raw data) from the ESO Archive at: http://archive.eso.org/wdb/wdb/eso/muse/form and process them if the users prefer to repeat the data processing themselves.
Hope this answers your question.
Best regards,
The ESO Archive Team

UVES Echelle products: corrections for barycentric or heliocen-tric motion
Hello, In the ESO Phase 3 Data Release Description (https://www.eso.org/rm/api/v1/public/releaseDescriptions/163) it is indicated (page 5) that "No corrections for barycentric or heliocentric motion have been applied.", but the information is in the header (HIERARCH.ESO.QC.VRAD.BARYCOR or HELICOR, in km/s).
In order to combine (e.g. average) different UVES spectra is it OK to use the header values for correcting manually barycentric or heliocentric motion before the combination of the spectra ? Is there a suggestion for this kind of operation ?
In any case, it is very nice to have these UVES spectra available. Thanks.
Dear User,
Thank you for reaching out to us.
The heliocentric or barycentric correction provided in the header is suitable for general purposes. However, I cannot confirm its precision. For a more detailed response tailored to your scientific requirements, I recommend opening a ticket at the following URL: https://support.eso.org/ and click on "Contact us"
HARPS - How to get the pipeline generated files (CCF, s1d, e2ds, bis, INT_GUIDE)
The HARPS pipeline generates separate products for both HARPS fibres (labelled A and B), cross correlating the observed spectra with template stellar spectra for various spectral types.
The primary product is a rebinned, combined 1-D spectrum in FITS binary spectroscopic data format. It is accompanied by a TAR file, containing the products of the original pipeline processing, both FITS and non-FITS.
Their content can be identified from their filenames. The root file name is “HARPS.<date_obs>”, where <date_obs> is the start of the observation in the “restricted ISO8601” format. This root name is appended with:
• “_s1d_<fibre>.fits” for 1-D extracted full spectrum, wavelength calibrated, in the solar system barycentric frame (the primary file of the release is the fibre A s1d file converted to the binary table format);
• “_e2ds_<fiber>.fits” for 2-D extracted spectrum, one row per order;
• “_bis_<sptype>_<fiber>.fits” for bisector from the cross correlation computed with the <sptype> mask;
• “_ccf_<sptype>_<fiber>.fits” for cross correlation function matrix for mask for ;
• “_ccf_<sptype>_<fiber>.tbl” for cross correlation function summary table (ASCII) with extracted radial velocity per each order;
• “_INT_GUIDE.fits” for integrated guiding image from the guide camera, used to confirm the correct centering of the star on the fibre. The image is integrated over the whole length of the scientific exposure.
Where:
• <fiber> is either “A” or “B”; in science observations the A fibre is used for the object, while the B fibre is used for ThAr lamp, dark or sky exposure, depending on the observation setup.
• <sptype> is either one of “G2”, “K5” or “M2”, depending on which spectral mask was used in cross-correlation with the spectrum. The pipeline automatically selects one of the masks based on the object’s spectral type, as recorded in the “HIERARCH ESO DPR TYPE” keyword. The “G2” mask is used if the spectral type is G9 or earlier or no spectral type is recorded, the “K5” mask is used for all Kn spectral types, and the “M2” mask is used for spectral types of M0 or later.
How can I get the CCF file? - edited
edited message -- I need the CCF file for radial velocity correction?
original message
How can I get the ccv file?
I need the ccv file for radial velocity correction?
Customer support service by UserEcho
